


Every business collects data, whether it means to or not: sales records, invoices, website visits, ad clicks, email opens, customer questions, stock levels. Most of it sits unused in spreadsheets and dashboards. Data analysis is how that information becomes useful: answering questions, spotting problems early and making decisions with more confidence.
This guide explains data analysis for business owners and marketers: the types of data and analysis, a practical process, how it applies to sales and marketing, how to read website analytics, the main tools, and the mistakes that lead to wrong conclusions. It includes worked examples with real formulas.
Introduction to data analysis
What is data analysis?
Data analysis is the process of inspecting, cleaning, organizing and interpreting data to answer questions, find patterns and support decisions. It ranges from adding up monthly sales in a spreadsheet to statistical models that forecast demand.
Why businesses collect data
To understand what is happening (sales, costs, customer behavior), to find out why, to predict what may come next and to decide what to do. Without data, decisions rely on memory and instinct, which are easily biased by the most recent or most memorable events.
How data supports better decisions
Data replaces “I think” with “we know,” or at least “the evidence suggests.” It helps you compare options, set realistic targets, spot problems early and check whether a change actually worked.
Data, information, insights and decisions
| Level | What it is | Example |
|---|---|---|
| Data | Raw facts and figures | 1,240 website sessions, 31 form submissions |
| Information | Data organized with context | Conversion rate fell from 3.8% to 2.5% this month |
| Insight | An understanding of why | The drop is all on mobile since a form update |
| Decision | Action based on the insight | Fix the mobile form and monitor for two weeks |
Types of data
- Structured data: organized in rows and columns with defined fields, such as sales tables or CRM records. Easy to analyze.
- Unstructured data: free text, emails, images, call recordings, reviews. Harder to analyze, though AI tools increasingly help.
- Quantitative data: numbers that can be measured: revenue, visits, order value.
- Qualitative data: descriptions and opinions: survey comments, interview notes, reasons for cancellation.
- First-party data: collected directly from your customers and website, such as purchases, sign-ups and analytics. The most valuable and reliable.
- Second-party data: another organization’s first-party data shared with you through a partnership.
- Third-party data: data bought or obtained from organizations with no direct relationship to the people in it. Its use is increasingly limited by privacy rules and browser changes.
Types of data analysis
| Type | Question | Example |
|---|---|---|
| Descriptive | What happened? | Sales were $84,000 in March, up 6% on February |
| Diagnostic | Why did it happen? | Growth came from returning customers after an email campaign |
| Predictive | What may happen? | Based on past seasons, April demand is likely to rise 10 to 15% |
| Prescriptive | What should we do? | Increase stock of top sellers and schedule the campaign earlier |
| Exploratory | What patterns exist that we did not expect? | Customers who buy product A often buy product C within 30 days |
The data analysis process
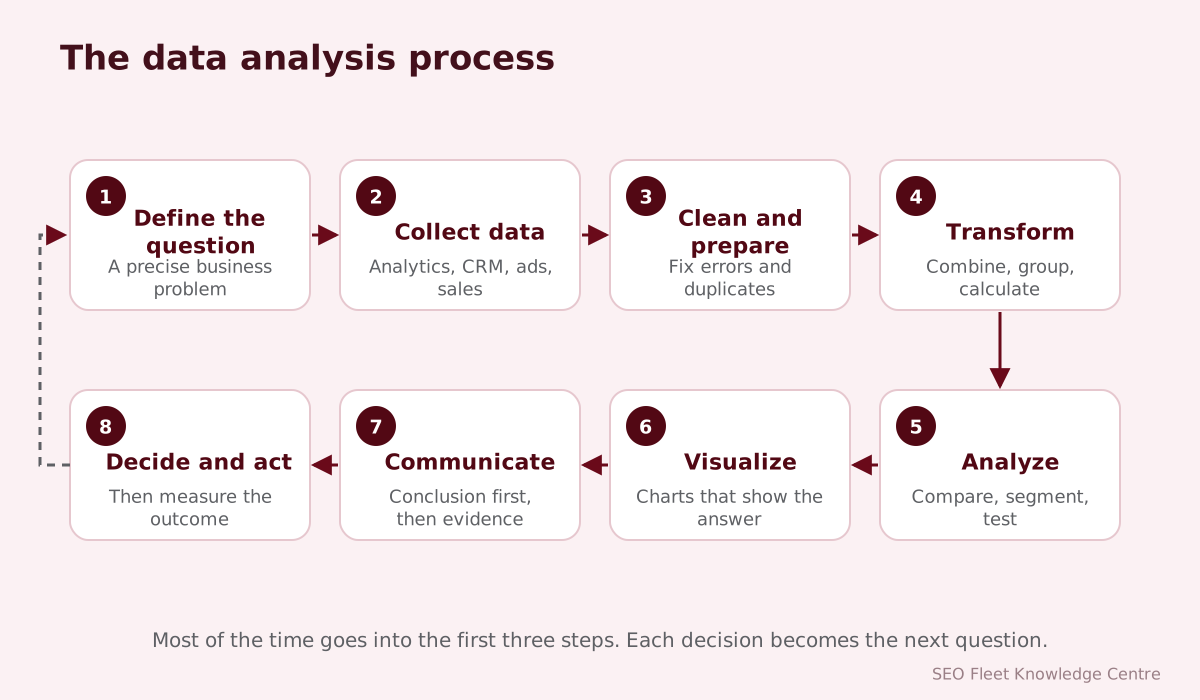
- Define the business problem. A precise question (“Why did cost per lead rise in Q3?”) beats a vague one (“How is marketing doing?”).
- Collect relevant data. Identify sources: analytics, ad platforms, CRM, sales records, surveys.
- Clean and prepare data. Remove duplicates, fix errors, handle missing values, standardize formats (dates, currencies, names).
- Organize and transform. Combine sources, create calculated fields, group by period or segment.
- Analyze patterns and trends. Compare periods and segments, look for changes and outliers, test explanations.
- Visualize findings. Charts that make the answer obvious.
- Communicate insights. Lead with the conclusion and the recommended action, then the evidence.
- Decide and measure outcomes. Act, then check whether the change produced the expected result.
Data analysis in business
- Sales performance: revenue by product, region, salesperson and channel; win rates and sales cycle length.
- Customer behavior: purchase frequency, basket size, preferred channels and timing.
- Financial performance: margins, cash flow, cost trends and profitability by service.
- Inventory and operations: stock turnover, stockouts, delivery times, capacity.
- Employee performance: workload and productivity measures, used fairly and with context.
- Customer retention: repeat purchase rate, churn rate and reasons for leaving.
- Forecasting: demand, revenue and staffing needs based on history and trends.
Data analysis in digital marketing
Marketing produces more data than almost any other function. These are the measures that matter most, with formulas:
| KPI | Formula | Example |
|---|---|---|
| Conversion rate | Conversions ÷ sessions (or clicks) × 100 | 45 leads ÷ 1,500 sessions = 3% |
| Cost per lead (CPL) | Marketing cost ÷ leads | $2,250 ÷ 45 = $50 |
| Customer acquisition cost (CAC) | Total sales and marketing cost ÷ new customers | $4,000 ÷ 10 = $400 |
| Return on ad spend (ROAS) | Revenue from ads ÷ ad spend | $12,000 ÷ $3,000 = 4 (or 400%) |
| Customer lifetime value (CLV) | Average order value × purchases per year × years retained | $150 × 4 × 3 = $1,800 |
| CLV to CAC ratio | CLV ÷ CAC | $1,800 ÷ $400 = 4.5 |
| Click-through rate (CTR) | Clicks ÷ impressions × 100 | 300 ÷ 10,000 = 3% |
Also analyze website traffic by source, search engine performance in Google Search Console (impressions, clicks, queries, pages), keyword performance in organic and paid search, advertising expenditure by campaign, and social media performance (reach, engagement and, most importantly, visits and conversions). Our article on marketing KPIs that matter goes further.
Website analytics explained
Google Analytics 4 (GA4) is the most widely used free website analytics tool. Its main concepts:
- Users: people (more precisely, browsers or devices, or signed-in users) who visited.
- Sessions: visits. One user can have many sessions.
- Page views (views): pages or screens viewed.
- Traffic sources: where visitors came from: organic search, paid search, social, email, referral or direct.
- Engagement: GA4 counts an engaged session when a visit lasts longer than 10 seconds, includes a key event, or has at least two page or screen views. Engagement rate is the share of sessions that were engaged.
- Landing pages: the first page of each session, showing which pages bring people in and how well they perform.
- Events: everything GA4 records (page views, clicks, scrolls, form submissions) is an event.
- Key events (conversions): the events that matter most to your business, such as form submissions, calls or purchases, marked as key events.
Understanding reports: start with acquisition (where visitors come from), engagement (what they do) and key events (what they achieve). Compare periods, segment by device and source, and always ask what changed and why. Our GA4 setup essentials and UTM parameters guide help you collect clean data.
Popular data analysis tools
| Tool | What it does | Who should use it | Choose it when |
|---|---|---|---|
| Microsoft Excel | Spreadsheets, formulas, pivot tables, charts | Almost everyone | Data fits in a spreadsheet and you need flexibility |
| Google Sheets | Cloud spreadsheets with sharing and integrations | Teams that collaborate | Several people need to work on the same data |
| SQL | A language for querying databases | Analysts and technical staff | Data lives in databases or is too large for spreadsheets |
| Python | Programming for cleaning, analysis, statistics and automation | Analysts and data scientists | You need automation, advanced statistics or large datasets |
| Microsoft Power BI | Business intelligence dashboards and data models | Organizations using Microsoft tools | You need interactive dashboards across many sources |
| Tableau | Visual analytics and dashboards | Analysts and BI teams | Visual exploration and polished dashboards are priorities |
| Google Analytics 4 | Website and app analytics | Every business with a website | You need to understand visitor behavior and conversions |
| Google Search Console | Search performance and indexing data from Google | Website owners and SEO teams | You need data on how your site performs in Google Search |
Looker Studio (free from Google) is a popular way to combine GA4, Search Console, Google Ads and spreadsheets into shared dashboards.
Data visualization and reporting
- Line charts: trends over time.
- Bar charts: comparing categories (channels, products, regions).
- Tables: precise values and details.
- Dashboards: a set of key charts and numbers on one screen, updated automatically.
- KPI reports: a short regular summary of the metrics tied to business goals, with commentary.
- Trend analysis: comparing the same period year on year to account for seasonality.
Presenting complex information simply: start with the conclusion, show only the charts that support it, label clearly, use consistent colors and explain what the numbers mean for the business.
Common visualization mistakes: pie charts with too many slices, truncated axes that exaggerate changes, 3D effects, too many metrics on one chart, and charts without a clear question.
How to build a data-driven business
- Identify measurable objectives: for example, grow online leads 25% this year at a cost per lead under $60.
- Select relevant KPIs: a handful per objective, not dozens.
- Establish reliable data collection: analytics, conversion tracking, CRM discipline, consistent naming.
- Build regular reporting: weekly operational checks, monthly performance reviews, quarterly strategy reviews.
- Interpret results: ask what changed, why, and what it means.
- Turn findings into action: every report should end with decisions or next steps.
Common data analysis mistakes
- Incomplete data: missing tracking or unrecorded sales leads to wrong conclusions.
- Incorrect assumptions: deciding the answer first, then looking for supporting data.
- Confusing correlation with causation: two things rising together does not mean one caused the other. Ice cream sales and sunburn both rise in summer; neither causes the other.
- Tracking too many metrics: important signals get lost in noise.
- Ignoring data quality: duplicates, spam submissions and inconsistent definitions distort results.
- Decisions without context: ignoring seasonality, market changes, sample size or one-off events.
Data privacy, security and responsible data use
Collect only the data you need, explain how you use it in a clear privacy notice, obtain consent where the law requires it (for example for analytics and advertising cookies in the UK and EU), restrict access, keep data secure and delete it when it is no longer needed. Laws such as GDPR, UK GDPR, US state privacy laws (such as California’s CCPA as amended by the CPRA), Australia’s Privacy Act and India’s Digital Personal Data Protection Act set rules for personal data. Responsible data use is a legal duty and a basis of customer trust.
A worked example: finding why leads fell
Here is an illustrative example of the process in action. A consulting firm notices website leads fell from 60 one month to 41 the next.
- Question: why did leads fall by about a third?
- Check the data first: the form is working and tracking fires correctly in a test submission.
- Segment by source: organic search and email leads are stable; paid search leads fell from 25 to 8.
- Look inside paid search: clicks are similar, but the conversion rate dropped sharply on one campaign.
- Look for changes: that campaign’s ads were pointed to a new landing page on the date the decline began.
- Insight: the new page has a longer form and no phone number.
- Action: restore the shorter form, add the phone number and monitor for two weeks.
Segmenting, checking data quality and looking for what changed answer most everyday business questions without advanced statistics.
Sample size and statistical significance, in plain language
Small numbers are noisy. If a page converts 2 of 40 visitors one week and 4 of 40 the next, the conversion rate “doubled,” but the difference could easily be chance. Before acting on a change, ask whether there is enough data, whether the pattern holds over a longer period and whether it appears in more than one segment. For formal A/B tests, use a significance calculator and decide on the sample size before starting.
Conclusion: data is valuable only when it helps you make better decisions
Collecting data is easy; using it well takes a clear question, clean data, sound analysis and honest interpretation. Start with your business goals, track a small set of meaningful KPIs reliably, review them regularly and always connect findings to action. Over time, that habit makes a business noticeably better at spending money and spotting opportunities.
SEO Fleet provides data analysis, Google Analytics setup, marketing analytics and dashboard development services.


